
Recently, a close friend of mine became an executive at a large trucking company. He was surprised by how weak and limited their reporting was and asked for my advice. Here’s what I told him.
(1) System-Generated Reports Usually Aren’t Very Good
Unfortunately, the generic reports that come with your core software programs aren’t very good. Most big companies are running on older systems. Few older systems invested in developing great reports. The few reports they do have tend to be very generic and are not optimized for the unique niche your company competes in. Even modern systems don’t invest in very good reporting. They figure if you really care about reporting, you probably have a big system with a data warehouse and some other reporting tool like Tableau.
(2) You Don’t Need to Spend a Fortune
It’s easy to spend a LOT of money on analytic hardware, software and people. If you have abundant resources – do it! But if you’re like most businesses, Microsoft’s Excel / Power BI programs are all you need (and you’re probably already paying for them). Some people (usually people who are paid a lot of money to sell expensive programs) will tell you that a company using Excel for reports is a company that’s way behind the times. Not true. Excel and Power BI are world class programs with powerful analytical tools, visualization features, and abilities to connect seamlessly to nearly any other mainstream program. And, they’re easy to use and widely distribute at no extra cost to most businesses!
The biggest “fault” of Excel is it’s so easy to use and so widespread that it’s widely used by the untrained masses who don’t know what they’re doing. Reminds me of the city slicker who bought a chainsaw and tried to use it as a handsaw (not realizing it had a powerful engine that could do all the work for you).

The key to getting Excel / Power BI to work for you is to hire someone who knows what they’re doing. If you’re just getting started and aren’t ready to make a big long-term commitment, hire a consultant. A great consultant can quickly help your leaders understand what your business needs to know and will quickly build a few Excel / Power BI reports within a few weeks. This modest one-time investment will give you a huge boost to improving your business with information. It will clear the clouds. You’ll no longer be flying blind. It will be like the country boy who shows the city slicker how to use his chainsaw!

“People don’t want to buy a quarter-inch drill. They want a quarter-inch hole!”
(3) Focus on the Big Picture
One of my favorite quotes comes from marketing professor Theodore Levitt, “People don’t want to buy a quarter-inch drill. They want a quarter-inch hole!”. Stephen R. Covey calls this, “Begin with the end in mind.” Simon Sinek talks about understanding your “Why.” Lean Six Sigma practitioners start by asking, “Who is your customer and what do they value?”
Why do you want reports? Far too many people who work in this area are focused on giving you “drills” instead of “holes.” The goal is not to “have reports.” Nor is the goal to have “cool looking reports.” Reports are not toys; they’re tools. They are a means to an end. Investing in reports is making a bet — IF we have great reports THEN we’ll create value for the business.
Focus on the four I’s:
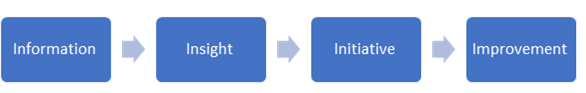
- Information: Reports should provide “information.” They should be more than just raw “data.” Sometimes it’s helpful to get a printout listing every transaction. But first, we need a picture with a clean overview of where we’ve been, where we’re at, where we’re going, and if we’re on track.
- Insight: Users should get “insights” within minutes (or even seconds) of viewing their key reports. Are we winning or losing? Where are the biggest problems and opportunities? Don’t just tell me what the report says; tell me what this implies! Connect the dots! Find the story!
- Initiative: Insights must lead to initiatives. If viewing reports is just an intellectual/academic exercise, you’re wasting your time. We need to “initiate” actions based on the insights we gain. Water the flowers. Pull the weeds.
- Improvement: Improvement is the ultimate measuring stick. Improve quality, increase sales, decrease costs, etc. Your goal is not to “build a report.” Your goal is, “Improve a key metric from X to Y by when.” The reports are just a tool. The reports failed if they don’t produce improvements.

(4) Goals
Every report should have a goal. Within 3 seconds you should be able to look at a report and know if you’re winning or losing. Without a clear goal, it’s difficult to know if you’re winning or losing. For beginners, the goal could simply be to do better than you did last year (or last month or last quarter). Lots of companies will set goals based on budgets (which are in turn tied to bonuses). Some companies set goal based on external factors (competitors or industry averages). Some believe in SMART goals, others believe in stretch goals.
It will take some experimentation to figure out what goals work best for you. If it encourages people to give a little extra and it gets people excited when they achieve it – you’re on the right path! If people have anxiety about the goal or don’t care about the goal – you’re probably on the wrong path.
(5) Too Many Reports. Too Many Options.
In general, organizations work best when they primarily focus on a few goals. There’s a place for having lots of data and lots of different reports for analysts and specialists to do what they do; but when it comes to the masses, narrow your focus. Too many metrics creates confusion. Be careful about adding too many options to your reports. If users have too many reports and too many options, they often ignore the reports. Or, worse, they manipulate the reports to see what they want to see and proceed with a false sense of confidence based on the “facts” in the reports.
(6) The Signal and the Noise
There is a LOT of noise in most reports. It’s easy to mistake “noise” for a “signal.” “Noise” primarily comes from 2 sources:
- Framing: Lots of reports are based on the calendar. The most prominent example for most companies is the P&L. One common problem stems from January having 31 days, February having 28 days, and March having 31 days. You’re going to laugh, but trust me — too many leaders think they have a problem when sales/profits fall 10% from January to February and then they make a bunch of changes and/or speeches and celebrate when sales/profits rebound in March. The second biggest problem with the calendar is variations in weekdays and weekend days. If January had 5 Saturdays and 5 Sundays this year, but only 4 of each day in the prior year, you’re going to get some noise. Most businesses I’ve worked with are best served by reports based on 7-day intervals (7 days, 28 days, 91 days, 364 days).
- Common Cause Variation: Another form of noise is what statisticians call “common cause variation.” Every system has “noise” in the metrics. The easiest way to explain this is to look at how much you weigh when you step on the scale each day. It’s normal for your weight to change by a pound or two from one day to the next. This doesn’t necessarily reflect a meaningful change. Generally, it’s just “noise.” Beware of celebrating or fretting over “noise.” Pay attention to the day-to-day movements, but don’t make any big decisions until you’re reasonably confident the variation you’re seeing is more than just the usual “noise.” It’s often helpful to use a control chart plotting individual values along with a centered average that reduces the noise.
(7) Refinement
It takes time and experimentation to figure this out. Don’t get discouraged. Don’t try to build every report you ever wanted all at once. Use an agile approach. Pick one important area and get a usable report within 2 weeks. Begin using the report in team meetings. Gather feedback from users and make changes. Remember – success is not measured by simply having a report and looking at it. It’s also not measured by winning a popular opinion poll among the users. Success is meaningful improvements. When you start to see meaningful improvements, you’re on the right path and ready to build the next report!